Metal Tools
- File Extension for Metal Shading Language Source Files
- Performing Frame Capture with Xcode
- The Label Property
- Metal System Trace
本章介绍了一些工具可以用于帮助你自定义和改进开发工作流
Creating Libraries During the App Build Process
在 app 编译阶段编译 shader language source file 以及 build a library(.metallib),这样比在运行时编译 shader source code 性能更好。可以通过 Xcode 编译 library 或者使用 command line
Using Xcode to Build a Library
项目中的所有 shader source files 将自动生成 default library,可以通过 metal framework code : MTLDevice 的 newDefaultLibrary 方法来访问
Using Command Line Utilities to Build a Library
下图展示了 command line 组成针对 metal shader source code 的 compiler 工具链。针对项目中的 .metal 文件,xcode 提供这些工具用于生成在app运行时可以访问的 library
将 shader source 在 xcode 中编译成 library 需要如下步骤
- 使用 metal 工具将单独的 .metal 文件编译成单独的 .air 文件,其中包含了一个shader language code 的 intermediate representation(IR)
- Optionally,使用 metal-ar 工具将多个 .air 文件合并成一个 .metalar 文件(metal-ar 类似于 Unix ar)
- 使用 metallib 工具将 IR .air 文件 或者 archive .metalar 文件编译成一个 metal library .metallib
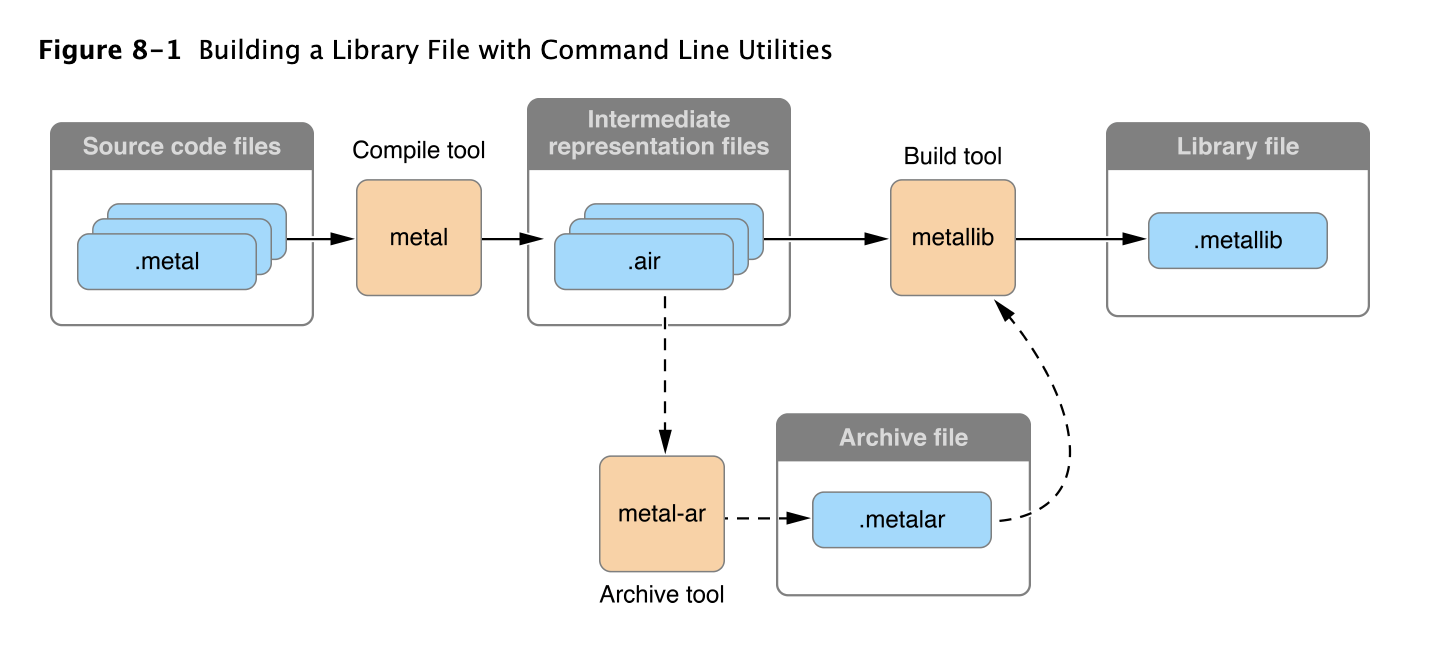
下列代码展示了将 .metal 文件编译成 .metallib 文件所需要的最少的命令
    	xcrun -sdk macosx metal MyLibrary.metal -o MyLibrary.air
		xcrun -sdk macosx metallib MyLibrary.air -o MyLibrary.metallib
下列代码展示了,在framework code中通过 newLibraryWithFile:error: 方法,访问生成的library
    	NSError *libraryError = NULL;
		NSString *libraryFile = [[NSBundle mainBundle] pathForResource:@"MyLibrary" ofType:@"metallib"];
		id <.MTLLibrary> myLibrary = [_device newLibraryWithFile:libraryFile error:&libraryError];
		if (!myLibrary) {
		    NSLog(@"Library error: %@", libraryError);
		}
Xcode Scheme Settings and Performance
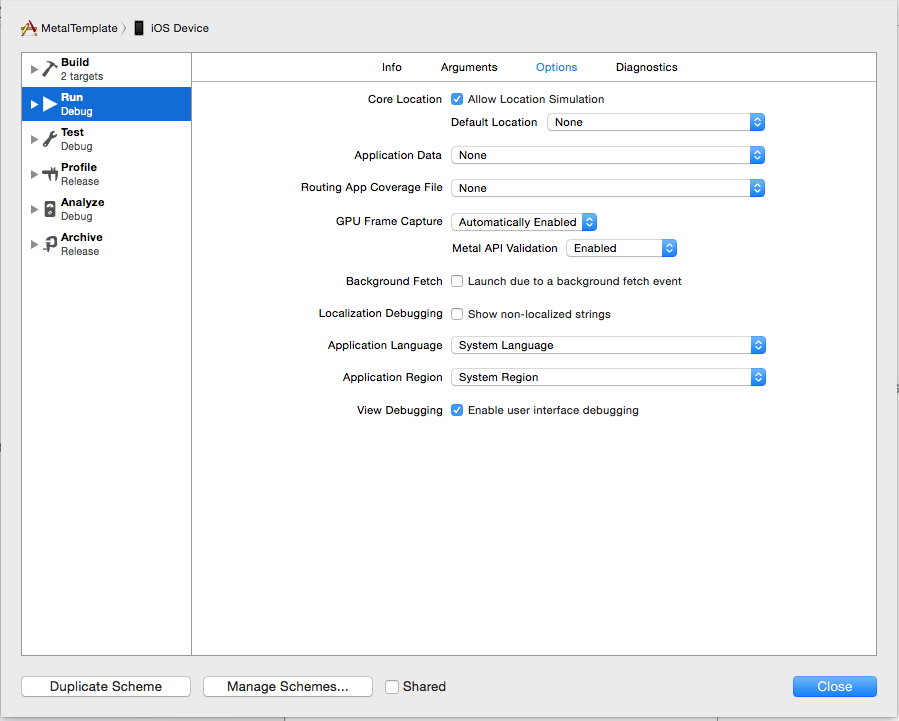
从 Xcode launch metal app 的时候,默认的 scheme setting 会降低性能。 xcode 会自动检测使用了哪些 metal api,然后启动 GPU Frame Capture 会 Metal API Validation setting,如下图所示。当开启 GPU Frame Capture 的时候,debug layer被开启。当开启 Metal API Validation 的时候,每个函数调用都会被validated,这些都会影响性能。这两个设置对 CPU 性能的影响比对 GPU 的影响大。除非关闭这些setting,否则 app run outside Xcode 的性能会明显更好
Debugging
使用下列 tips 在 debug 和 profiler metal app 的时候来获取更多信息
注意:只有 Xcode project 的 Deployment Target 被设置为最新的 SDK 的时候才开启 debug
File Extension for Metal Shading Language Source Files
针对 metal shading language source code file name,必须使用.metal文件后缀,来确保 development tool(xcode 以及 GPU frame debugger)在 debug 或者 profiler 的时候能识别源文件
Performing Frame Capture with Xcode
为了执行 xcode 的 frame capture 功能,需要开启 debug,并调用 MTLComandQueue 的 insertDebugCaptureBoundary 方法(Deprecated,Use MTLCaptureManager and MTLCaptureScope instead)。 MTLCommandBuffer 的 presentDrawable: and presentDrawable:atTime: 方法 也会出发 xcode frame capture,所以在这些方法没有 present 的时候,调用 insertDebugCaptureBoundary 方法。参考 Debugging Metal and OpenGL ES
The Label Property
许多 metal framework object-比如 command buffer、pipeline state、resource等-都支持 label 属性。可以使用这个属性来为每个object定义一个名字。这个label会出现在 xcode frame capture debugging interface上,使得你可以更简单的识别物件
类似的 insertDebugSignpost:, pushDebugGroup:, and popDebugGroup 方法使得你可以将 debug string 插入 command buffer,通过push 和 pop string label 的方法来识别 groups of encoded command
Metal System Trace
用 instrument 来 profile app,需要使用 metal system trace 工具。参考 Metal System Trace Profiling Template
本节教程就到此结束,希望大家继续阅读我之后的教程。
谢谢大家,再见!
原创技术文章,撰写不易,转载请注明出处:电子设备中的画家|王烁 于 2022 年 4 月 27 日发表,原文链接(http://geekfaner.com/shineengine/blog53_MetalProgrammingGuide_8.html)